
It is frequently used as a standard for long-term investing performance and comprises 500 of the biggest publicly traded companies in the US across a variety of industries.
Annual returns, which are typically given as a percentage that includes dividends reinvested, quantify how much the index increased or decreased in a single year.
Investors must comprehend annual returns over the past ten years in order to evaluate risk, evaluate performance trends, and create long-term financial plans.
This article will examine the S&P 500’s annual returns over the past ten years, providing in-depth analysis, trends, background information, and answers to commonly asked questions.
S&P 500 Annual Returns Last 10 Years — At a Glance
Below is a table showing the S&P 500’s annual total returns (including dividends) from 2016 through 2025 — the most recent full decade:
| 2025 | 17.88% |
| 2024 | 25.02% |
| 2023 | 26.29% |
| 2022 | -18.11% |
| 2021 | 28.71% |
| 2020 | 18.40% |
| 2019 | 31.49% |
| 2018 | -4.38% |
| 2017 | 21.83% |
| 2016 | 11.96% |
Performance Breakdown: Year by Year
Let’s examine the performance of each year and the state of the market. This clarifies the annual events and the reasons behind the index’s movements.
2016-The Post-Election Rally Starts
Return: 11.96%
Following the global slowdown in 2015 and early 2016, the market started to steadily recover.
Rising confidence and positive economic data drove investors into stocks.
2017-A robust bull market persists
Return: 21.83%
a nearly unprecedented run of profitable returns, indicating robust earnings, deregulation optimism, and economic growth.
In 2017, a wide range of sectors participated.
2018-Volatility and Trade Fears
Return: -4.38%
Increased volatility was caused by rising interest rates and trade tensions.
Geopolitical unpredictability and tariff announcements caused a strong market reaction.
2019- A Significant Recovery
Return: 31.49%
Following the decline in 2018, markets experienced a robust recovery.
Equities were bolstered by the Federal Reserve’s rate cuts and the optimism surrounding trade negotiations.
2020- COVID-19 Crash
Return: 18.40 percent
Massive fiscal and monetary stimulus propelled a swift recovery in the wake of a severe crash in early 2020.
In a market driven by the pandemic, the tech and healthcare sectors saw the biggest gains.
2021- Record Profits
Return: 28.71%
Robust returns resulted from a sustained economic recovery, low interest rates, and high corporate earnings.
2022 – Bear Market
Return: -18.11%
A notable decrease was caused by geopolitical unrest, inflation, and interest rate increases.
Among the most difficult years in the previous ten years was this one.
2023- Market Recovery
Return: 26.29%
As rates stabilised and inflation subsided, markets recovered.
The consumer discretionary and technology sectors grew rapidly.
2024- Further Development
Return: 25.02%
a continuation of the post-pandemic recovery propelled by investor confidence and company profits.
2025- Reliable Returns
17.88% return
Reflecting strong corporate fundamentals in the United States, the index maintained its long-term upward trend.
Trends and Patterns Over the Last Decade
Looking at the data above, several important trends emerge:
Bullish Bias
The S&P 500 had 8 positive return years and 2 negative ones over the last decade — showing a strong bullish trend despite occasional downturns.
The volatility of the market
Significant fluctuations in returns were brought on by important economic events, such as the COVID-19 pandemic and the rate-hiking cycle of 2022.
Dominance of Technology
Technology stocks have played a significant role in overall performance over the last ten years, particularly during prosperous years like 2021, 2023, and 2024.
Annual Returns vs. Average Returns
Mean Annual Return (2016–2025)
The S&P 500 delivered about 15% annually if you average the annual returns over these ten years. This is a significant improvement over the long-term historical average of about 10% over many decades.
Impact of Volatility
Despite this decade’s high average returns, the volatility (ups and downs) indicates that investors need to be able to withstand volatility in order to generate solid long-term returns.
The Significance of These Returns
Comparing Performance
S&P 500 returns are used by investors to evaluate the performance of their portfolios in comparison to the market.
Long-Term Growth Perspective
The returns demonstrate the potent effect of compound growth, particularly when dividends are reinvested.
Investor Psychology
Investors can maintain discipline during volatile times by being aware of fluctuations.
Extended Historical Context
It’s important to consider more general history in order to fully understand the return record of the past ten years:
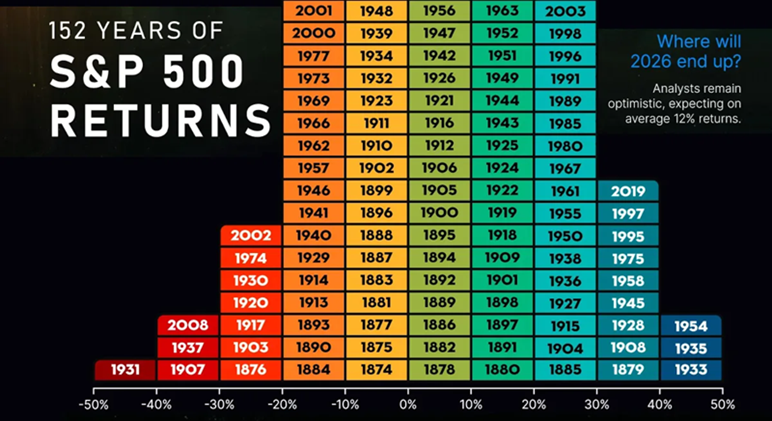
With dividends reinvested, the S&P 500 has averaged an annual return of roughly 10% over several decades. This covers both severe recessions and robust market expansions.
Due to robust post-pandemic economic growth, the 2016–2025 period performed better than this long-term average.
Important Elements Affecting Annual Returns
The following factors influence returns on the S&P 500:
Business Profits
Strong earnings are the main factor that typically causes stock prices to rise.
Rates of Interest
Stocks are more appealing than bonds when interest rates are low.
Growth of the Economy
Corporate profits are typically increased by robust GDP growth.
Investor Attitude
Markets may overreact due to both fear and confidence.
Events in Geopolitics
Global crises, trade disputes, and wars can all cause instability.
What This Means for Investors
Long-Term Investing Is Effective
Due to prosperous years, long-term investors who stayed invested generally profited despite short-term declines (such as those in 2018 and 2022).
The Whole Picture Is Not Shown by Average
Big swings can be hidden by simple averages; some years are significantly higher or lower than average.
Compound Returns Have Significant Power
Growth compounds over time when dividends are reinvested, which is a crucial lesson for long-term investors and retirement savers.
FAQ (Most Asked Questions About S&P 500 Annual Returns)
Q1 — What was the best year for S&P 500 returns in the last decade?
A: Among the last 10 years, 2019 saw one of the strongest performances (31.49%) with 2023 and 2024 also delivering very high returns.
Q2 — Which year had the worst return?
A: 2022 was the worst year, with a decline of -18.11%, driven by rising interest rates and economic uncertainty.
Q3 — Should I expect the same returns in the future?
A: No — while historical performance provides context, future returns can vary widely due to economic changes.
Q4 — Do these figures include dividends?
A: Yes — the percentages shown here include total returns with dividends reinvested, which is standard for long-term investing analysis.
Q5 — What’s the long-term average return for the S&P 500?
A: Historically, over many decades, the S&P 500 has averaged around 10% annual returns including dividends reinvested.
Conclusion
The resilience and growth potential of U.S. stocks are demonstrated by the S&P 500 annual returns last 10 years. Overall, the trend favoured long-term investors, even though some years saw losses and others saw impressive double-digit gains.
The following important investing lessons were reinforced during this decade: ✔ Reinvest dividends for compound growth ✔ Use the S&P 500 as a performance benchmark ✔ Stay invested despite volatility
Knowing these returns is essential for making wise decisions, regardless of your level of experience as an investor or where you are in your financial career.